用Lisp可视化量子因式分解Shor算法的例子
Ping Zhou, 2021-06-11
在前文中我初步尝试了Lisp的数值计算和绘图功能,本着“拿着锤子找钉子”的精神,这次我们来搞个实际的应用,用Lisp来演示和可视化量子因式分解算法(Shor算法)。
首先还是引用numcl和vgplot包:
(ql:quickload :numcl)
(ql:quickload :vgplot)
假设我们要分解的数是N(前文的例子中N=21),Shor算法需要先在1到N-1之间随机选一个与N互质的数a,然后用量子计算求解函数 \(f(x)=a^x \mod N\) 的周期r。要可视化这个求解的过程,我们得先知道r,所以先写个辅助函数:
(defun a-x-mod-N (a x N)
  (mod (expt a x) N))

;; Find order for function f(x)=a^x mod N
;; also returns the "modulo sequence" of the function.
;; E.g. a=11, N=21 -> returns order r=6 and sequence (1 11 16 8 4 2)
(defun shor-find-mods (a N)
  (labels ((next-mod (a x N mods)
             (let ((r (a-x-mod-n a x N)))
               (if (equal r (car mods))  ; check if the mod sequence is repeating
                   mods                  ; stop when mod sequence starts repeating
                   (next-mod a           ; otherwise continue with a^(x+1) mod N
                             (+ 1 x)
                             N
                             (append mods (list r)))))))
    (let ((mod-seq (next-mod a 0 N nil)))
      ;; "values" returns multiple values
      ;; By default the first value is used, but caller can get other values using
      ;; multiple-value-bind:
      ;; (multiple-value-bind (a b) (foo))
      (values (length mod-seq) mod-seq))))
a-x-mod-N 函数很简单,就是返回 \(a^x \mod N\) 的值。
shor-find-mods 从x=0开始,逐个计算 \(a^x \mod N\) ,把结果记录到一个序列里,直到序列里发现重复,这时候序列的长度就是函数的周期r。另外序列本身也作为副产品返回给调用方。例如在前文的例子中,N=21,a=11 ,返回的序列就是 (1 11 16 8 4 2),周期是6:
CL-USER> (shor-find-mods 11 21)
6 (3 bits, #x6, #o6, #b110)
(1 11 16 8 4 2)
然后演示的核心函数:计算运行量子电路后,测量得到每个y的可能性。
;; q: 2^n, determined by how many qubits we use (N^2 <= Q <= 2*N^2)
;; r: the period of function a^x mod N (e.g. N=21, a=11 -> r=6)
;; l: the offset
;; y: the "y" value for calculating its probability, from 0 to Q-1
(defun shor-qft-prob (q r l y)
   (let* ((m (+ 1 (numcl:floor (/ (- q l 1) r))))
          (qm-inv (/ 1 (* q m))))
     (cond ((= y 0) (/ m q))
           ((< y q) (* qm-inv
                       (/ (expt (sin (/ (* pi m r y) q)) 2)
                          (expt (sin (/ (* pi r y) q)) 2))))
           (t (error "y must be integer between 0 and q-1")))))
这个函数 shor-qft-prob 有四个输入:
q就是我们的量子位能表达的最大的二进制数,用n个量子位的话,q就是 \(2^n\)r就是前面求出的函数周期l就是前文中的“offset”,在0到r-1之间y在0到q-1之间,这个函数返回测量得到它的可能性
然后,对y=0到q-1分别调用上面的函数 shor-qft-prob ,得到X和Y轴的序列,用于绘图:
(defun shor-compute-probs (q r l)
  (let* ((Ys (numcl:arange q))
         (Cy (mapcar (lambda (y)
                       (shor-qft-prob q r l y))
                     (coerce Ys 'list))))
    Cy))
可视化函数 shor-compute-probs-vis ,X轴是0到q-1,Y轴就是对应的概率。
(defun shor-compute-probs-vis (q r l)
  (let ((x (vgplot:range q))
        (y (shor-compute-probs q r l)))
    (progn
      (vgplot:plot x y)
      (vgplot:axis (list 0 (- q 1)))
      (vgplot:xlabel (format nil "y values (from 0 to ~a)" (- q 1)))
      (vgplot:ylabel "probabilities")
      (vgplot:title (format nil "Probability distribution: Q=~a, r=~a, l=~a" q r l)))))
试试我们的可视化函数:
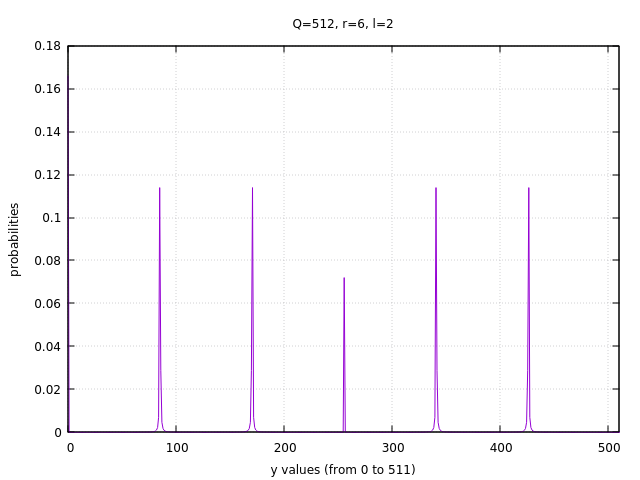
(shor-compute-probs-vis 512 6 2)

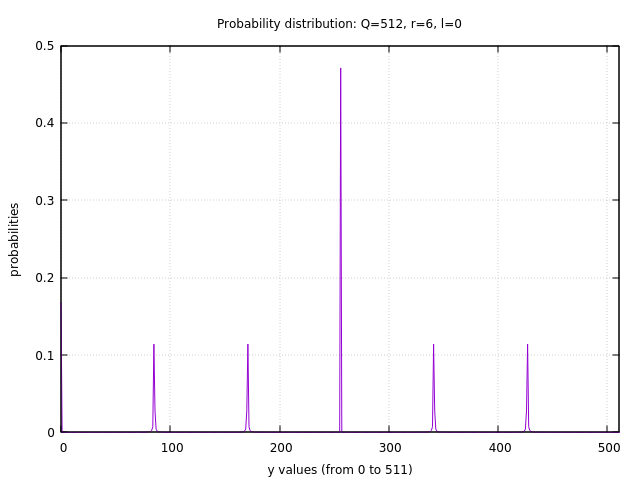
调整一下offset (l=0):
(shor-compute-probs-vis 512 6 0)

Lisp真有意思啊!